LOOKER-BUSINESS-ANALYST Online Practice Questions and Answers
A company has an operational dashboard that needs to display the latest data every 5 minutes on a monitor.
How should the analyst configure the dashboard?
A. Set the dashboard schedule to run every 5 minutes.
B. Set the dashboard auto refresh to 5 minutes.
C. Set the dashboard to run on load every 5 minutes.
D. Set the dashboard schedule to 5 minutes and "send if the results have changed".
Users find it difficult to distinguish the dashboards they need for tracking sales performance. There are more than 30 operation-related dashboards in the same folder.
What should the analyst do to improve the navigation experience?
A. Pin the dashboards into boards and grant user access to the individual dashboards.
B. Add descriptions to the dashboards to give more details.
C. Sort the dashboards in the folder by name.
D. Show the dashboards in a grid style for displaying the snapshot.
An analyst has an Explore query that shows the sum of spend over time. The Explore query has the Sum of Spend measure pivoted by a Category of Spend dimension. The Category of Spend dimension has a value for Budgeted Spend and then categories for each type of unbudgeted spend.
Which visualization feature should the analyst use to separate budgeted spend visually from each category of unbudgeted spend?
A. Display row totals for each category.
B. Series type customization on budgeted spend.
C. Grouped series positioning on budgeted spend.
D. Transpose table to separate out budgeted spend.
Two users report seeing different results on the same dashboard.
Which three configurations could explain these discrepancies? (Choose three.)
A. The time zone setting is different for each user.
B. Looker caching is affecting results.
C. The dashboard uses separate Explores for each user.
D. Dashboard filters are being used
E. The dashboard was accessed via different boards.
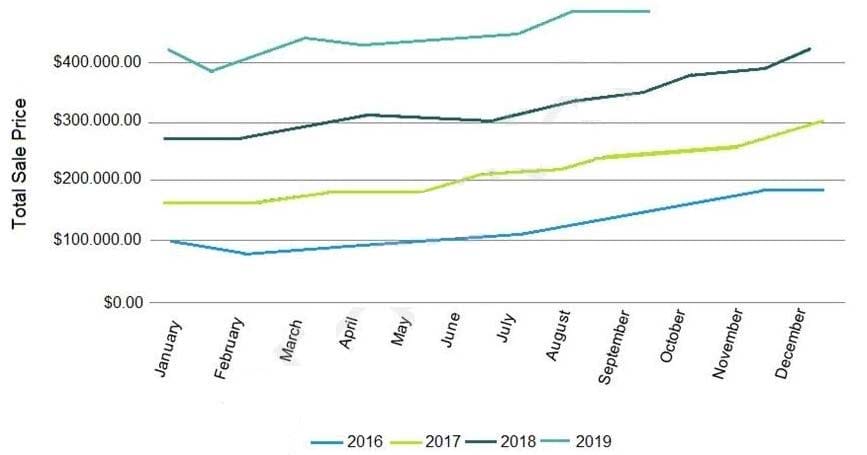
An analyst needs to compare monthly sales, year over year, based on when an order was created, as shown in the exhibit.

How should the analyst, in addition to selecting the measure Total Sales build the report?
A. Select the dimension Created Month, and pivot on the dimension Created Year.
B. Select the dimension Created Year, and pivot on the dimension Created Month.
C. Select the dimension Created Month Name, and pivot on the dimension Created Year.
D. Select the dimension Created Year, and pivot on the dimension Created Month Name.
An analyst needs to analyze the ecommerce quarter-over-quarter order growth. Two fields are given: Order Created Quarter and Order Count.
Which table calculation function should the analyst use to calculate the quarter-over-quarter order growth?
A. pivot_offset()
B. lookup()
C. offset_list()
D. offset()
A business analyst is using the Totals check box in an Explore to get the sum of a column of values. The number that appears in the Total row is much higher than the analyst expects, and this number is not the sum of the values in the column.
What is a possible cause of this discrepancy?
A. There is a row limit applied.
B. There is a filter on a dimension.
C. There is a problem with the underlying LookML.
D. There is a column limit applied.
An analyst at a banana quality assurance firm needs to compare performance week over week to make sure the firm stays on track. The analyst needs to show two metrics:
1.
Number of bananas cleared for consumption the previous week
2.
Number of bananas cleared for consumption the week before that Which process should the analyst follow to show these two metrics in a report?
A. Create two tiles on a dashboard and two dashboard filters. Apply a different filter to each tile ("last week" and "2 weeks ago" respectively)
B. Create one tile on a dashboard and two dashboard filters ("last week" and "2 weeks ago" respectively). Apply both dashboard filters to the tile.
C. Create two tiles on a dashboard. In the Edit mode of one tile, add a filter for "last week". Add a dashboard filter for "2weeks ago" and apply it to the other tile.
D. Create two identical looks in the same folder. Add filters on them for "last week" and "2 weeks ago" respectively.
An analyst has created a dashboard that needs to be integrated into the company's internal support portal. The dashboard should match the style of the support portal.
How should the analyst display the dashboard in the style of the support portal without changing the style of the tiles in Looker?
A. Copy the dashboard.
B. Edit embed settings.
C. Apply a table theme.
D. Edit HTML on the dashboard.
An analyst has a dashboard with table visualizations that display the first few results, and the user can scroll down to see the remaining results. The analyst wants to download a PDF of the dashboard.
How should the analyst ensure that the PDF shows all available results in the UI dashboard?
A. Select the Expand Tables option.
B. Select the All Results option
C. Select the Allow Scroll option and specify each table.
D. Select the Paper Size option and specify a large size.