CSSGB Online Practice Questions and Answers
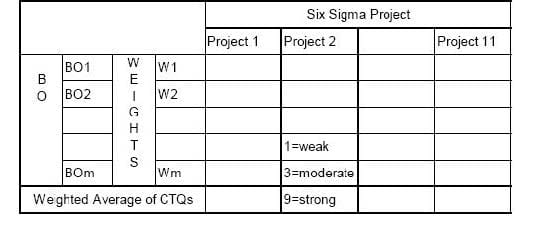
Construct a table that shows how to prioritize potential Strategic Six Sigma projects based on their relationships with business objectives. Explain how the table functions to accomplish its aim.
A bar chart that depicts the frequencies of numerical or measurement data.
A. Sample
B. Histogram
C. Check Sheet
D. Process Map
A set of values or items selected from some population.
A. Factors
B. Alpha Risk
C. Sample
D. Sample Size
Which of the following is the key objective of a six sigma project?
A. Developing detailed control charts for critical processes
B. Developing a matrix to understand the how's and what's of a problem process
C. Reducing variation in critical processes
D. Reducing investment costs while improving output quality
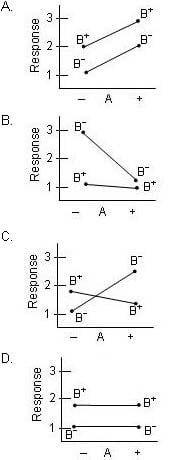
Which of the following graphs represents a factorial experiment with the strongest interaction?

A. B. C. D.
When calculating the Cp index, what does the standard deviation represent in the formula ?

A. The tolerance interval
B. The confidence interval for the result
C. The range of the process
D. The variance of the index
The actual experimental response data varied somewhat from what a Belt had predicted them to be. This is the result of which of these?
A. Inefficiency of estimates
B. Residuals
C. Confounded data
D. Gap Analysis
As part of a Visual Factory plan Kanban cards are created and utilized to identify areas in need of cleaning and organization.
A. True
B. False
A process can be defined as a repetitive and systematic series of steps or activities where inputs are modified or assembled to achieve a _______________ result.
A. Revenue total
B. Month end
C. Customer desired
D. Budgeted
Measurement System Analysis is a procedure used to quantify all ____________ in the method or system used for taking measurements.
A. Totals
B. People involved
C. Variation
D. Summations
